
BLAKE's Baby Steps: Time Tracking
In addition to positioning Audacious Software as a business that delivers data-driven solutions, I've been working hard to make sure that the business itself is as data-driven as it can be. This means that determining the overall health of the company, tracking progress on deliverables, and monitoring sustainability are at the top of my priority list.
In this post I'll describe how I'm applying a data-centric approach towards time and effort tracking.
To quickly recap, BLAKE is a system I'm building to assist with the management of Audacious Software as I relaunch the business. It's driven by a single simple goal: any recurring question that I have about the health or state of the business, I should be able to answer by simply pulling up a webpage. To that end, I've been working on a dashboard for myself that I can monitor while working to stay informed.
On the time- and effort-tracking front, I am always asking several questions:
- What's my progress meeting this week's billable hours goal?
- How much time am I spending on non-billable work?
- How much time am I spending on individual projects? Individual clients?
- How much ahead/behind am I meeting specific client obligations?
- How am I doing meeting my annual revenue goals?
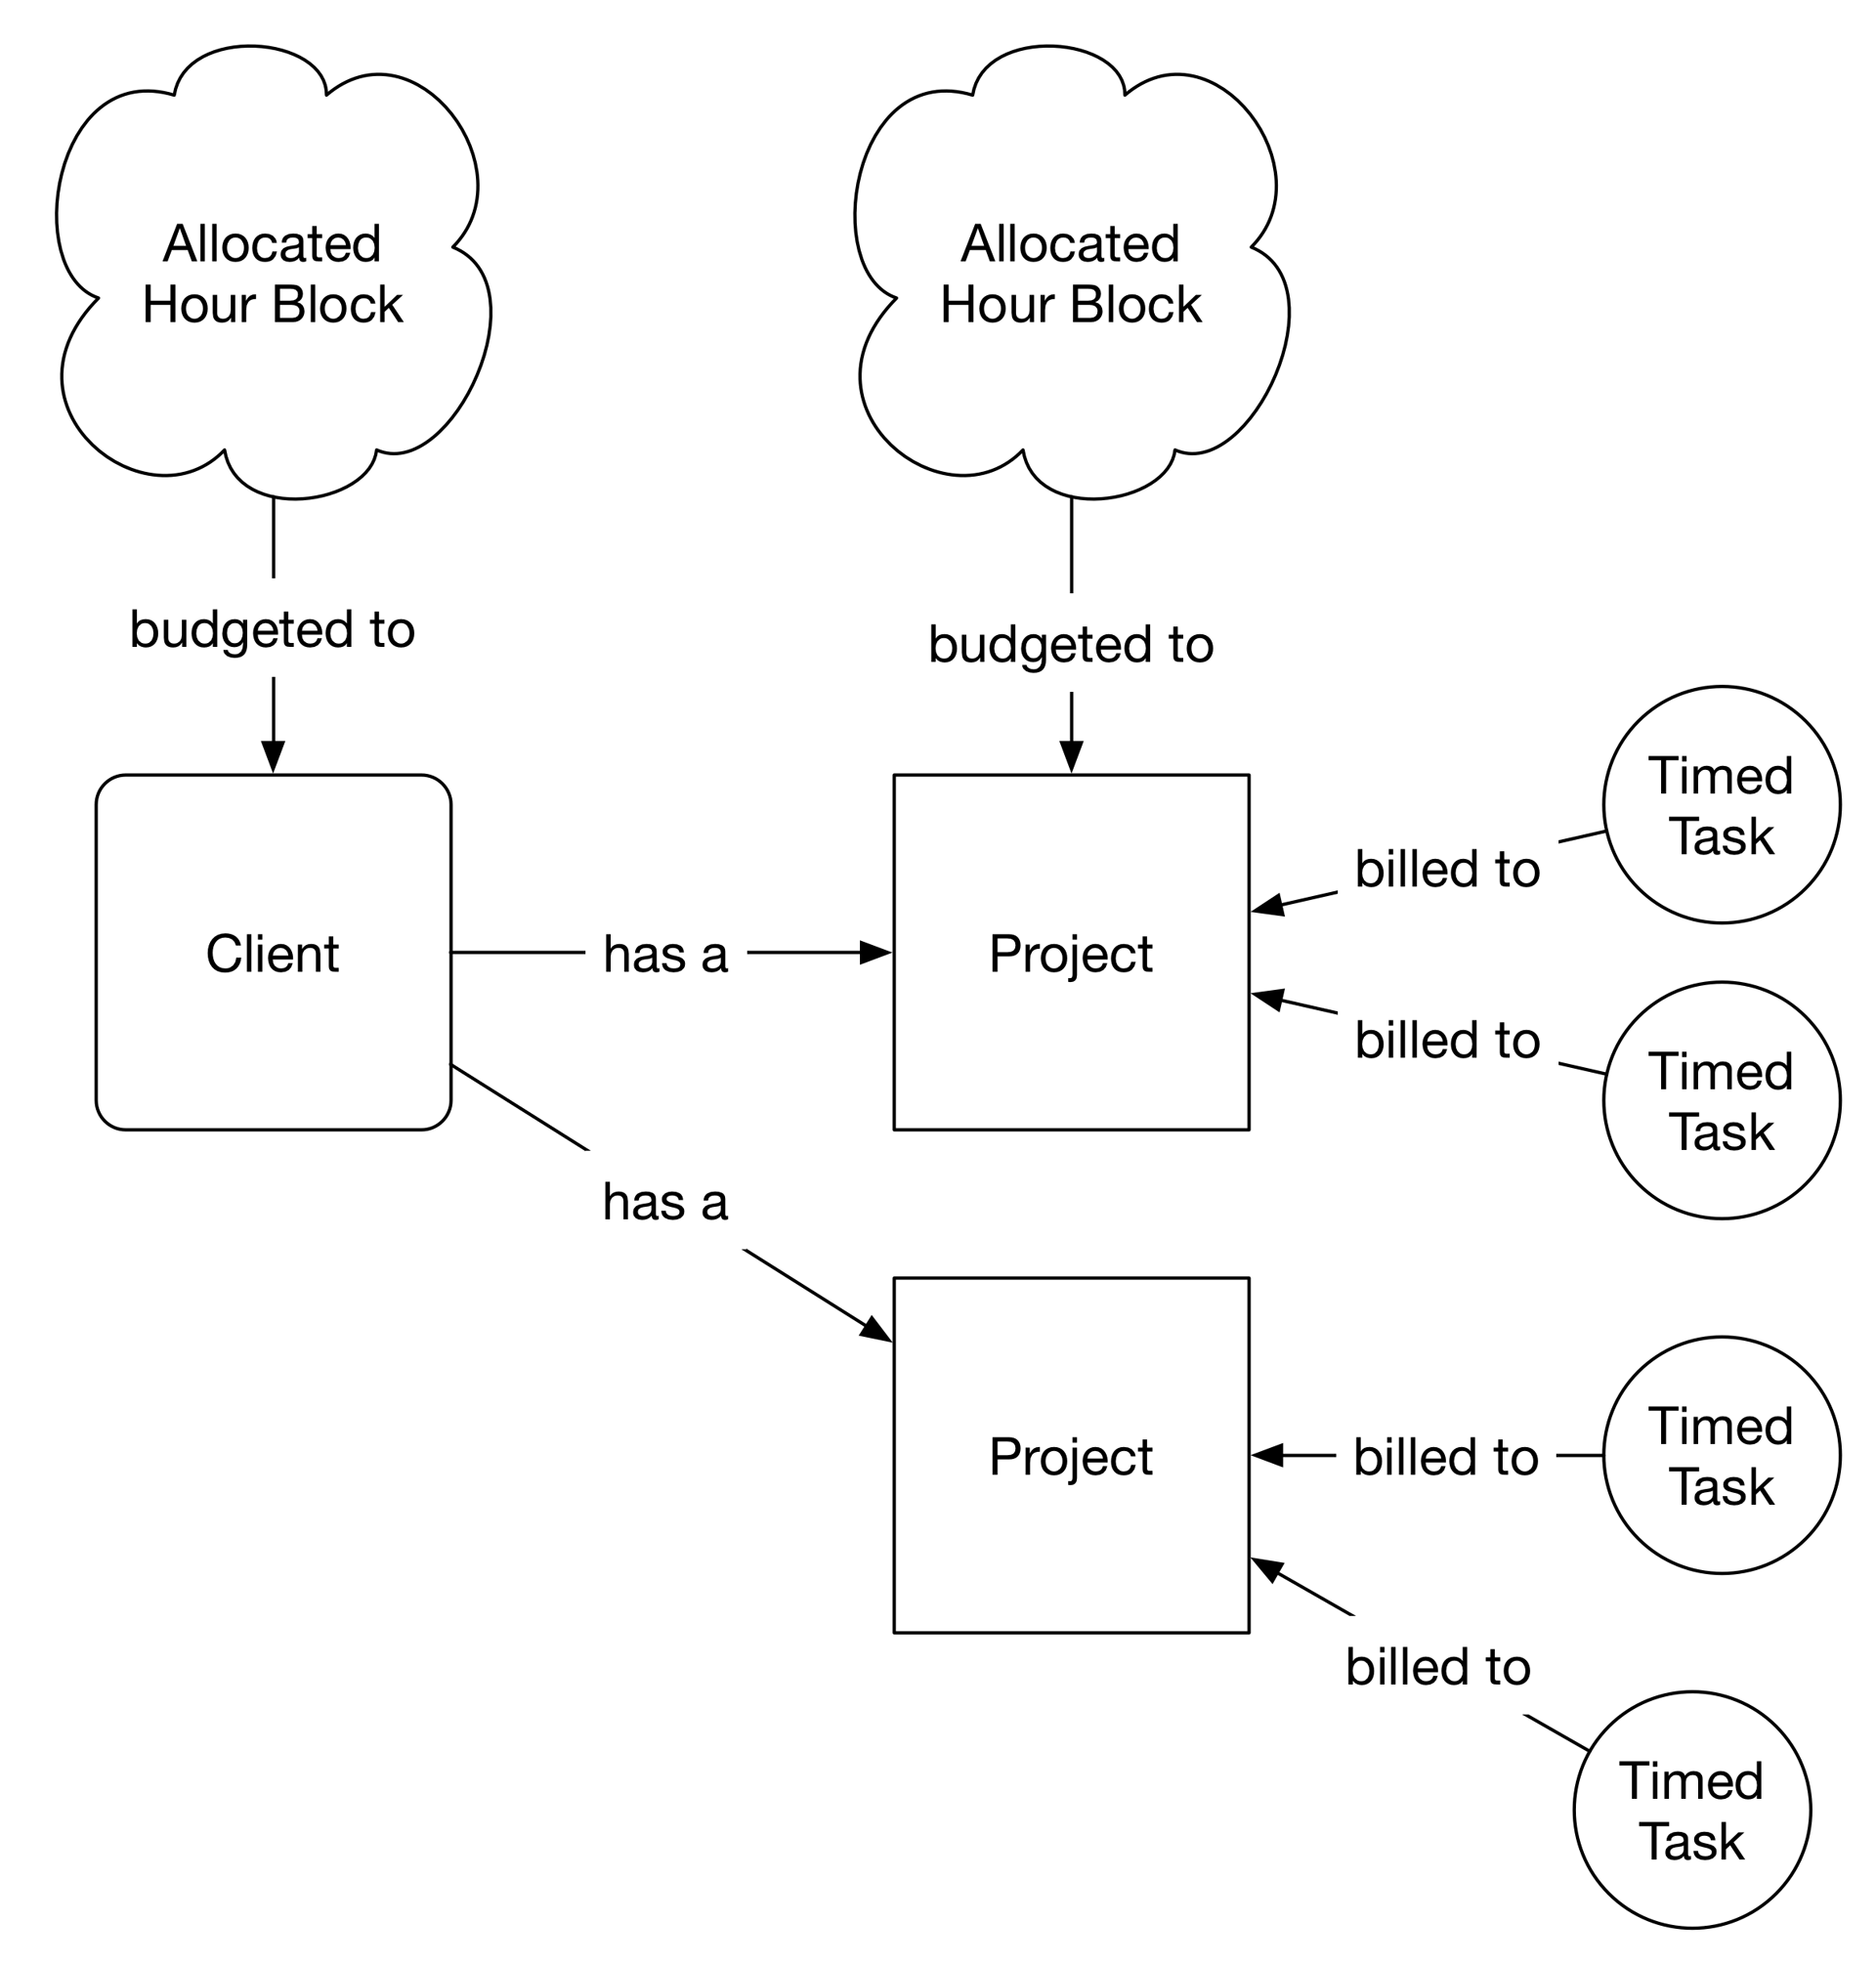
Before I get into the visual components, I want to talk a bit about the underlying object model. Basically, there are four classes of objects relevant to this discussion:
- Client: Holds information about specific customers. In this context, a client someone or something that writes checks for services provided.
- Project: Time and effort are contributed toward achieving the ends of some goal or deliverable. This is a project.
- Allocated Hour Block: This is encodes an estimate or a commitment towards a client or project. This is used to track progress (hours spent) towards a goal (hours estimated/allocated).
- Timed Task: This is an instance of an atomic unit of time and effort expended. These are always associated with projects and the goal is to have enough billable instances of this class to achieve weekly and annual goals.
An illustration of the relationships between objects:
All of these objects are situated in the context of two main operational goals:
- I should be completing at least 40 hours of billable work a week.
- I should sell 2000 hours of billable hours per year (40 hours per week * 50 weeks per year).
While the goals may seem trite and simplistic, making them explicit allows me to hold myself accountable in a micro and macro fashion:
Micro: Setting a goal of completing 40 billable hours a week is important to maintaining a semblance of a work-life balance because if I hold myself to that goal each week, that will reduce the amount of variance of billable work completed from week to week. When left to my own devices, I have tendency to "go deep" into one project or another, promising myself to make up the difference in hours for another project next week. This small goal reinforces the notion that this endeavor is a marathon, and not a sprint, and I should pace myself accordingly. This goal primarily maps onto the Timed Task objects.
Macro: Completing 40 hours per week for 50 weeks is not a useful goal if I can't sell those hours to bill. Keeping track of how many hours have been allocated to clients out of that 2000 hour pool allows me to understand at a glance when it's time to put my head down and complete billable hours and when it's time to get out in the world and sell those hours to clients. This goal maps onto the Allocated Hour Block objects.
If I can complete both sets of goals, Audacious Software will be a financially sustainable enterprise.
Let's dive into my personal dashboard now.
The Effort section includes three visualizations: Weekly Billable, By Project, and Yearly Billable. These three visualizations answer a number of questions posed above.
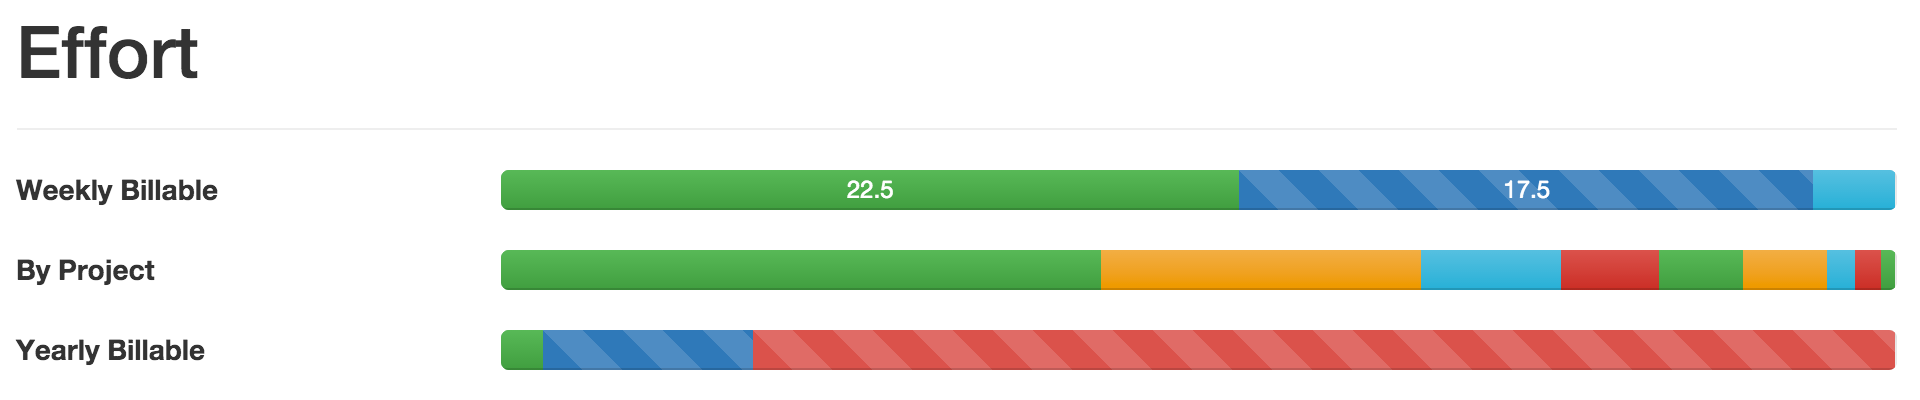
An incomplete week (less than 40 billable hours completed).
Weekly Billable tracks progress toward the goal of completing 40 billable hours per week. The left side of the bar consists of two regions: green represents the number of billable hours completed this week and the blue striped section shows how many hours are needed to hit the weekly goal. If the number of billable hours exceeds 40 hours, a third dark-blue region will appear to plot how many "overtime" hours were completed in excess of the goal (see below). On the right-most side of the graph may appear a light-blue region that represents unbillable hours completed. Unbillable hours are times spent on tasks that can't be invoiced, including work on internal projects, new client development, and business operations.
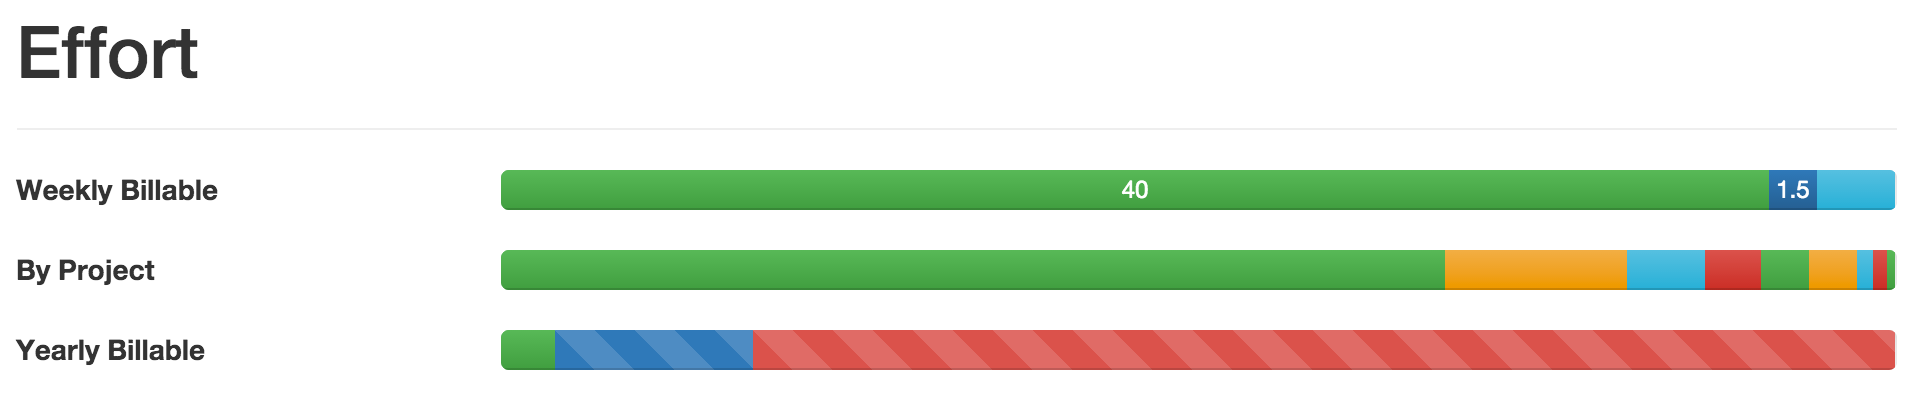
A complete week (more than 40 billable hours completed).
Weekly Billable reinforces two main behaviors. The billable hours progress bar shows how close to the 40-hour goal I am. In a perfect world, each week will end with a full green bar (and maybe a little bit of "overtime"). By pulling the billable hours out into the right side of the bar, this helps keep weekly unbillable time in check by visually displaying the ratio of billable to unbillable work done during the week. In my experience, it's seductively easy to start mentally counting unbillable time as "work done" while neglecting the work that actually generates income.
By Project simply shows the how time (billable and unbillable) has been spent between projects during the week. The behavior this is reinforcing is to try and maintain a balance between projects during the week and to not lose oneself in one set of tasks at the expense of others.
Yearly Billable is a visual snapshot of the year to date. The green region illustrates how many of the year's 2000 billable hours have been completed. The blue striped region indicates time that has been budgeted to clients for projects, but not yet completed. The red striped region represents the remaining time to be sold. As the completed hours (green) overtake the budgeted hours (blue striped), I know that I need to start looking for new projects and turn the red striped regions blue. When no more red is visible in this bar, I've sold all the time I available for the year, and new projects will have to be budgeted for the next calendar year.
The Clients section consists of a progress bar for each client's contribution to the weekly goal. A full progress bar represents 40 hours of work that week. This is mainly useful to answer the question "for whom" am I working this week. This is not intended to influence any other behaviors.
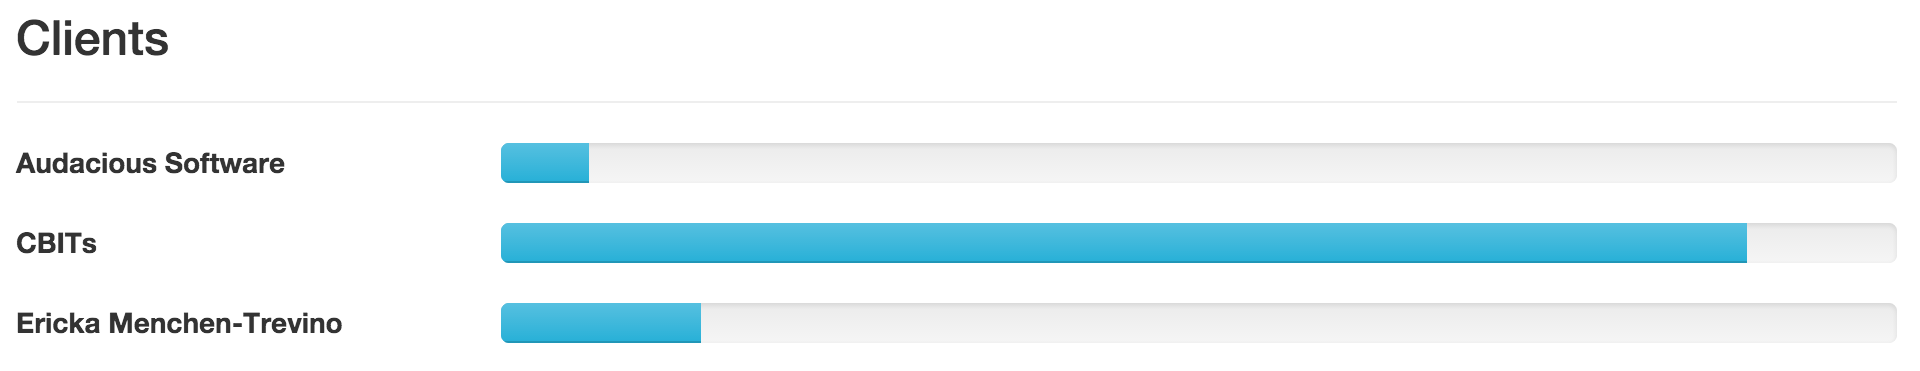
Client time comparison.
The Active Time Blocks are where I keep track of my progress against the time I've budgeted for a client or a project. Each bar consists of four possible regions:
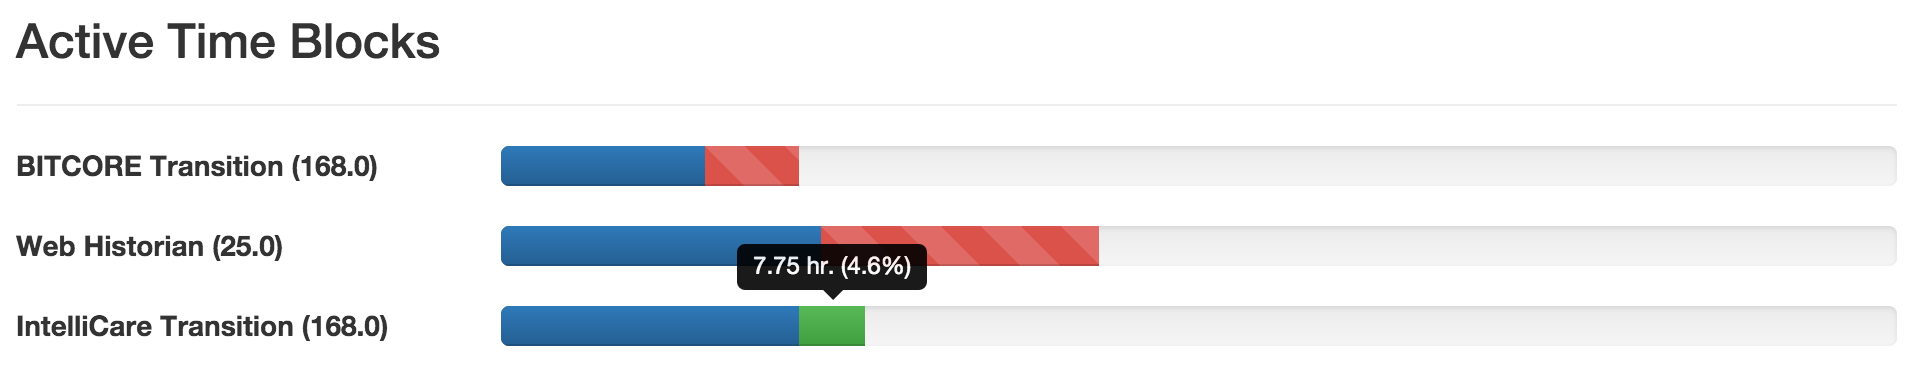
Progress on various Allocated Time Blocks.
- The blue region represents the number of hours completed in the budget.
- The red striped region represents where I'm falling short of the projected progress. This area expands daily based on the number of hours estimated per day to stay on track.
- The green region represents where I'm ahead of expectations.
- The empty region represents the remaining time in the budget. As time gets closer to the end date of the budgeted time, this region will shrink.
Note that the sum of all active time blocks in a given year is the same as the amount of time sold in a given calendar year. This specific presentation simply breaks those down by project and/or client.
While I'm just passing the two-week mark in 2016, simply making this data visible in this simplistic form has already had a noticeable affect on my own behavior and discipline. It reinforces the importance of billable hours and provides a nice snapshot of the calendar year in terms of projects secured and remaining time to sell. The active time blocks have been very motivating to keep me on-track in terms of sustainable progress instead of a more sporadic start-stop-start pattern I've often found myself repeating.
At the moment, BLAKE treats billable hours as gold, and unbillable time as something to be avoided. While logging a sufficient number of billable hours is the primary goal that this interface is supporting, unbillable time represents strategic investments intended to pay off later. As I get into a more steady rhythm using this system to hit the "stay in business and pay the mortgage" financial goals, in the future I'll be thinking more about how I can start to represent some of this unpaid time and other investments as part of the overall health of the company. I haven't quite solved that puzzle yet, and it will become more important around March when I begin to start to seek out billable projects that employ infrastructure built on internal time (PassiveDataKit and Narrative Realms).
In my next post about the BLAKE system, I'll describe the task tracking and management system for keeping up with incoming bug fixes, feature requests, and maintenance tasks that fill up my workdays.